Newsletter July 2018
New Navigation Menu
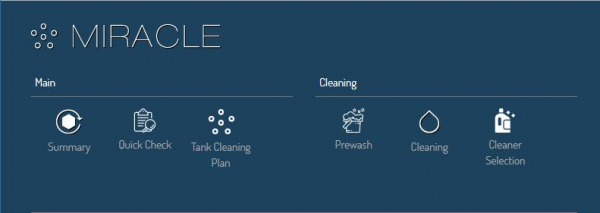 Many users want to use MIRACLE on mobile devices such as tablets or smart phones. As a first step to improve the usability on these devices the Navigation Menu has been changed to a responsive design. It will now respond on the screen size of the device and rearrange accordingly. To open the navigation menu, drag the cursor on the list icon and select the desired module.
Quick Check Modul
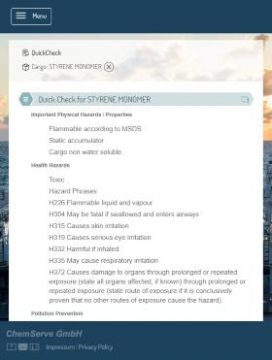
A new module called Quick Check has been launched to allow an overview of the most important properties of a cargo at a glance. This includes important properties and characteristics, hazards, handling instructions, cleaning advice with an abbreviated recipe and restrictions as well as incompatibilities.
To see this module, select a cargo, drag the cursor onto the list icon and click on Quick Check.
UV Graphs for Washing Water Analysis
The ever-increasing application of washing water analysis by UV Spectrometer requires the UV wavescan for the cargo in question. This UV wavescan can be downloaded as Excel File for many frequently transported cargoes, such as Styrene Monomer. The link for the download is displayed in the cleaning module, where the graph is available. An explanation of the washing water analysis is now included in the cleaning seminar.
Washing Water Analysis with UV spectrometer allows to monitor the results of washing process during and after the cleaning.
The washing water analysis means taking samples from the washing water effluent during the washing process and analyzing the sample with a UV spectrometer. This allows a fast and efficient control of the cleaning process without interruption and confined space entry.
The underlying principle is the concentration measurement of cargo remainings in the wash water.
An effective cleaning method will remove cargo clingage from tank and pipeline surfaces. Thus the washing water will contain a certain amount of the cargo.
A small quantity from the wash water sample introduced into the UV spectrometer delivers a curve (UV Wavescan) that indicates both, the magnitude of the concentration and the type of the cargo. The height of the peaks indicate the concentration, the shape of the curve is typical for the cargo that was in the tank.
Significant conlusions are possible from interpretation of this information.
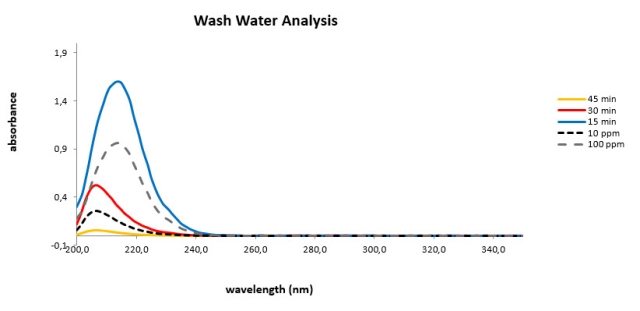
Blue line: Sample after 15 min shows a significant concentration of previous cargo. This indicates that the cargo is transported by the washing water out of the tank.
Red line: After 30 min a remarkable reduction of the concentration is observed.
Yellow line: A nearly flat line after 45 min indicates that no cargo is transported anymore out of the tank.
The dashed lines are standards that are available for many cargoes. Comparison with those allows instantaneous assessment of the removed qauntity. Sampling in regular time intervals allows monitoring of the progress. In this example the cleaning step can be finshed after 45 min. No cargo is removed anymore. If this is water soluble cargo it means the tank is clean. If this a non water soluble cargo it means continuation will not improve anything. It could mean go to next step.
Photo Ionization Detector (PID)
Photoionization detectors measure volatile organic compounds and other gases. The photoionization detector is an efficient and inexpensive detector. Their primary use is for monitoring possible worker exposure to volatile organic compounds.
In a PID high energy photons break molecules of the volatile organic compunds that should be measured into charged ions. These ions produce an electric current, which is the output signal of the detector. This signal is equivalent to the concentration of the component that should be measured.
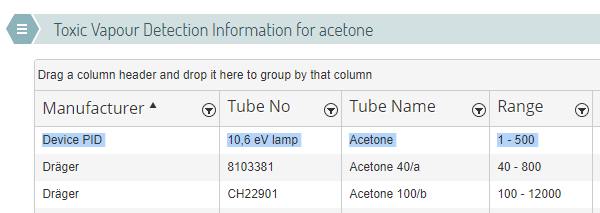
For use on board of tankships they have some key advantages compared with the usual measurement tubes.
The device is handheld and produces instantaneous readings. It operates continously. For measuring of various compounds just reference values must be available instead of an inventory od measurement tubes. The reference value for the typivally used 10.6 eV lamp is independent from the manufacturer of the lamp.
Change Log
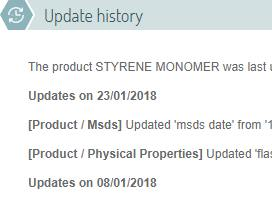
The latest update of a cargo is displayed in the header of the selected cargo and the content that has been changed can be viewed in the footer of the summary module.
Search History
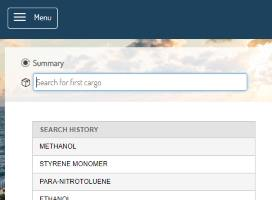
The latest cargoes that were viewed are listed in a search history table, which is always displayed when the user is looking for another cargo.